Access Point Shaping Rate Display (2019-11-12)
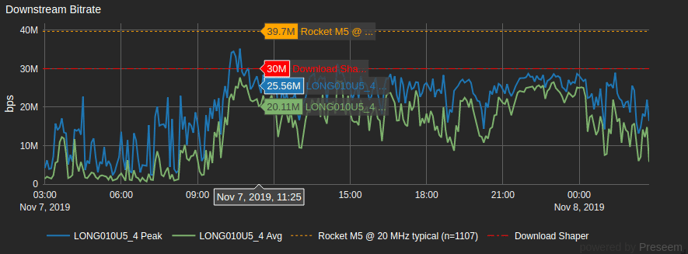
Preseem supports access point (AP) rate shaping to ensure a good subscriber QoE on overloaded APs. This is accomplished by keeping the bandwidth below the link saturation point so that Preseem's AQM techniques can still optimize the subscriber experience.
Now, when the AP shaping rate is set, the shaping rate is plotted on the bandwidth chart for the AP making it more obvious when AP shaping is enabled.
New Data Features (2019-10-10)
Preseem collects billions of metrics per day about network, access point and subscriber quality of experience (QoE). Leveraging this dataset to help our customers understand and diagnose network problems is a big focus for us. Below are a few new features to help you understand the root cause of QoE problems and manage network capacity.
Access Point (AP) Comparisons
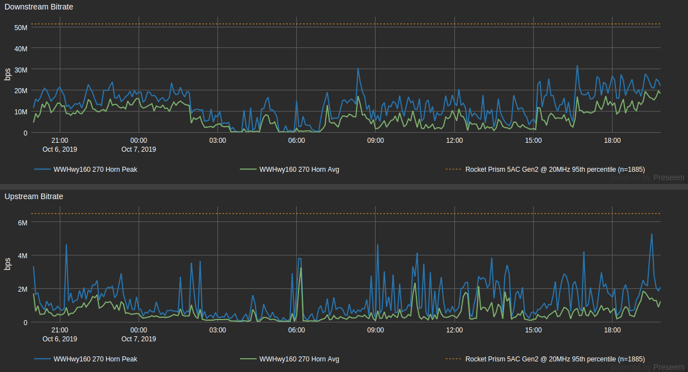
Preseem sees data from tens of thousands of access points. Using this dataset we now build a model of the performance for each access point model and use this performance model throughout the system to provide an accurate picture of what the AP should be capable of.
To make it simple to compare an individual AP against the performance model, we now plot key metrics overlaid on each of your individual APs. By looking at these comparisons it is possible to identify under-performing APs and those that have reached the limits for the model and should be split or upgraded.
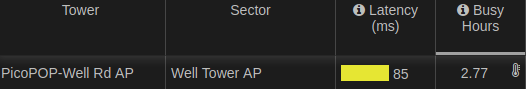
Busy Hours
The Busy Hours metric is designed to tell the operator how many hours in the given day that the AP is operating at or near capacity. Since the network quality of experience is at its worst when the AP is busy, this tells the operator how often subscribers receive the worst case QoE. This metric has been enhanced to make use of the per-AP model information built from all access points that Preseem monitors, making it much more accurate, especially in cases when the AP has a small number of subscribers.
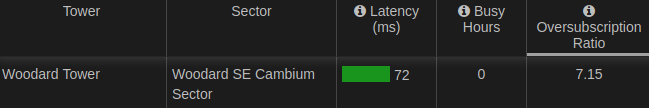
Oversubscription Ratio
All consumer access networks are oversubscribed. The business model simply doesn't work to give every customer dedicated bandwidth from the edge to the Internet. However, monitoring the oversubscription ratio is an important step to ensuring that the access network doesn't get overloaded and that subscribers get a good QoE. Preseem calculates the oversubscription ratio as:
sum(subscriber plans on AP) / typical performance of the AP
where the typical performance is based on the model built from analyzing the thousands of APs that Preseem monitors.
The next edition of the Preseem Fixed Wireless Report (to be released 2019-10-14) provides an analysis of per-AP oversubscription across the industry.
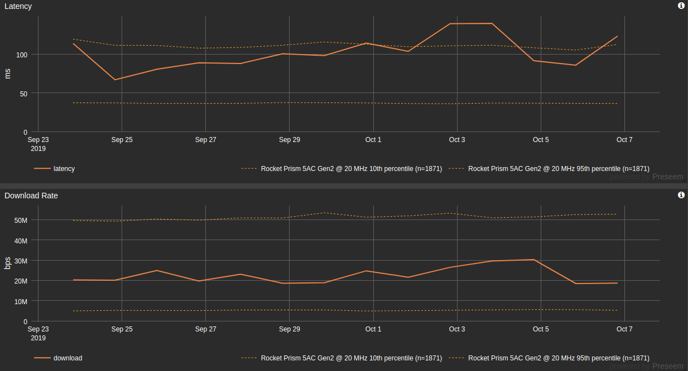
Daily View of Wireless Summary Metrics
Preseem's Wireless Summary provides a summary of the network QoE when the network is at its busiest based on a combination of active subscribers and throughput. Since an idle network almost always delivers good QoE, measuring QoE at the busiest times of day provides a much more accurate picture of the real subscriber experience.
Previously the daily Wireless Summary metrics for an individual AP were only available in table form. Now, these important metrics can be viewed over time to see longer term trends and better plan upgrades or other changes that are required to maintain a good QoE. This view also provides comparison information for the same AP model and channel width to provide guidance on what one can reasonably expect out of the given AP model.
Small Features
Wireless Summary has been further enhanced to show:
* The AP vendor and model
* The number of connected stations (previously only active subscribers was present)
Preseem Element 1.10.0 (2019-10-04)
The Preseem element software refers to the software that runs on the hardware that is deployed in the network (vs cloud side of Preseem).
The main focus of this release is a significant performance increase for all platforms that run Preseem. Small change list, lots of work.
Features
- Significantly increase throughput both in terms of bandwidth and packets per second for all hardware platforms. This was accomplished by reducing lock contention and making better use of many CPU cores.
- Improved logging of link state changes to better enable debugging of link level problems
- Reduce the time required to create shaper instances and other state when new IPs are observed. This reduces the time to start publishing metrics for deployments with many thousands of subscribers (smaller deployments won't notice this).
- preseemctl session show now has a --format=csv option to aid in investigating session state
- preseemctl debug ipmap now has a --format=csv option to aid in investigating internal IP counters
- preseemctl debug internal-metrics now exposes internal process metrics
Upgrade Notes
- This release changes system parameters that can only be modified at boot time. Therefore a system reboot is required after the upgrade.
- Preseem appliances are automatically configured (post-reboot) for maximum performance.
Additional, hardware specific configuration is required to get maximum performance from customer provided hardware. Without these changes, the performance will remain roughly the same as previous releases. Please work with Preseem Support when upgrading to make the appropriate changes. - https://docs.preseem.com/upgrade
Chart Context Menu (2019-09-10)
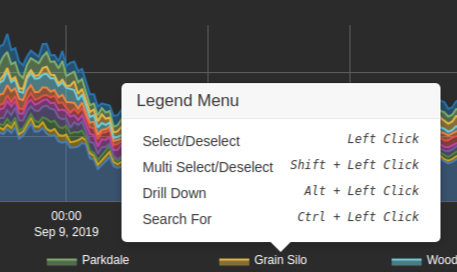
Preseem has long supported keyboard shortcuts which enable you to search for or jump to the items in the chart legends. While these keyboard shortcuts made it much faster to navigate and use Preseem, they weren't easy to remember and required users to become 'power users' quickly. We have now added a right click context menu to the chart legend to solve these problems. The context menu both allows you take the available actions (select, drill down, search) and shows the keyboard shortcuts so those users wishing to become power users can do so over time without having to remember the keyboard combinations. Yay!
Search Improvements (2019-09-10)
Previously, the IP search would only match IPs attached to subscribers. The search results now contain IPs that are not currently assigned to subscribers.
The Support search now leverages search improvements introduced on Explore earlier. This makes it more intuitive to find subscribers based on various portions of the subscriber name or identifier.
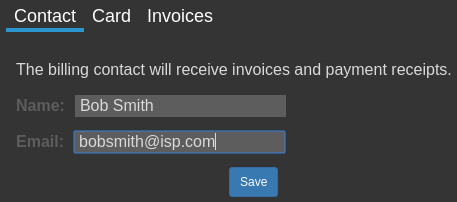
Billing Admin Improvements (2019-09-10)
The billing page now enables admin users to change the email address that receives invoices and payment receipts.
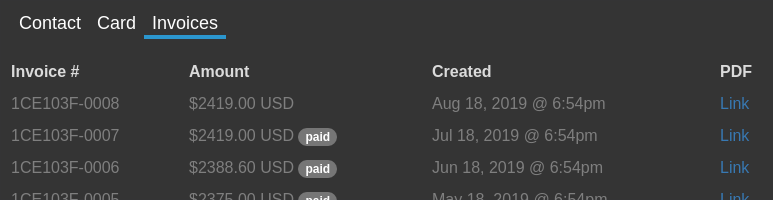
It is now also possible to view the entire invoice history and download copies of each invoice.
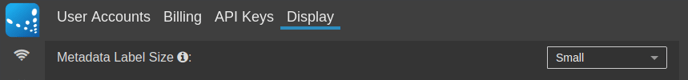
Display Density (2019-07-19)
Some customers have very long identifiers such as the subscriber, access point and other network element names. For these customers the default layout is too small. To address this we added a setting which changes the layout to add more space for those that need it.
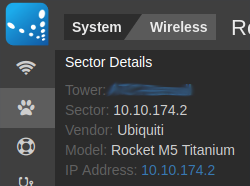
Quick Link From AP to Tower (2019-07-02)
When viewing an Access Point the only way to get back to the associated tower was to select it from the tree view again. This was annoying so we added a quick link in the Access Point view.
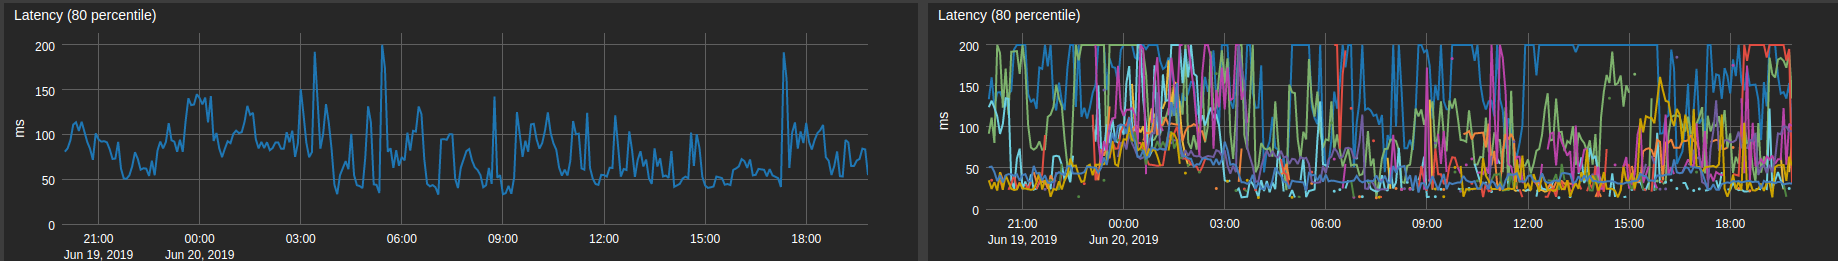
Latency Chart Normalization (2019-06-28)
The Tower and Sector level latency charts previously graphed the 80th percentile latency for all latency samples tagged to that tower or sector. This had the drawback that specific customer services with a high number of samples could have an unfair influence on the sector's latency chart, and a specific sector with a high number of samples could have an unfair influence on the tower's latency chart.
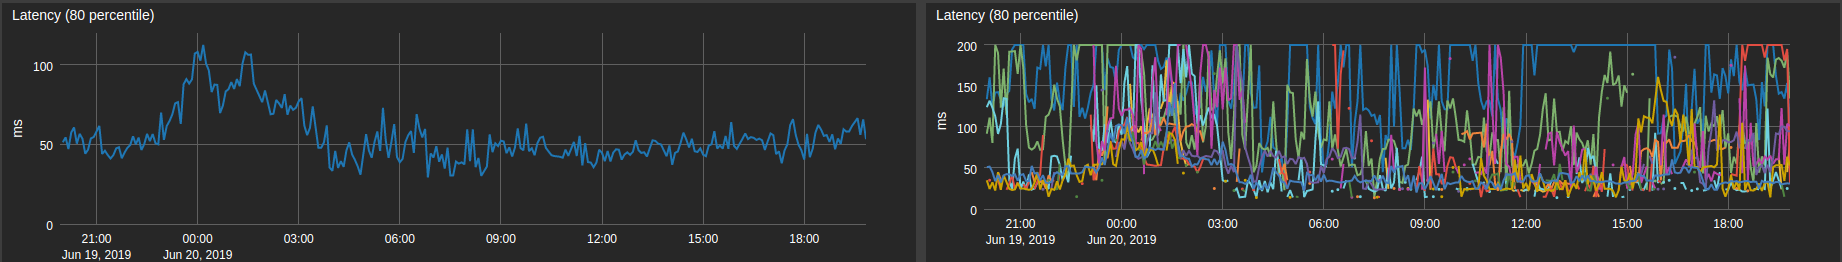
This change normalizes sectors by customer sessions and towers by sector, so that the latency chart provides a better representation of the overall quality experienced by customers on that tower or sector.
An example of the Explore view for a sector is shown below. The first picture is without normalization, and the second picture is with normalization. Notice that the second chart follows the shape of the majority of customer sessions more closely.
This change takes effect on the Explore application and the Support application.
API for Third Party Integrations (Beta) (2019-06-21)
Preseem has built-in integrations with many of the billing systems commonly used by WISPs which makes it very easy to get up and going when one of the supported billing systems is in place.
However, not all WISPs use one of the supported billing systems so a mechanism to integrate with home grown or other billing systems is required. While our trusty 'Google Sheets' integration is great for trials, a more programmatic approach is desirable. To that end, we have added a new external model API which can be used to build these integrations. At present, we consider this to be beta but there are already customers using it in production.
New Search Backend (2019-06-14)
Both the Explore and Search views in Preseem contain a search feature which enables the user to search all of the information that Preseem contains such as the access points and subscribers.
Previously, the search in Explore had two modes. The first mode would do partial matches based on the entered text. The second mode did an exact match on the entered text when enter was pressed. This behaviour wasn't intuitive as the results changed if enter was pressed or not.
The Explore search now acts like a Google search. That is, any entered text is used for the search whether or not enter is pressed. To make this work we rebuilt the back end to add a scoring system to the search results so that the most relevant results are shown first. The new search also tokenizes the string before performing the search so that "Joe Smith" and "Smith Joe" will return the same search results.
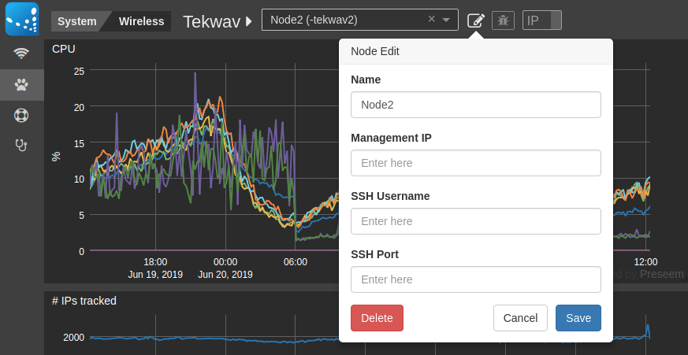
Element Properties (2019-06-14)
The System view in Explore shows information about individual Preseem network elements. Previously the list of elements only showed the element ID and it was not possible to remove decommissioned elements without asking Preseem support. It is now possible to set a pretty name for the element which will be used throughout the UI and it is also possible to remove elements that are no longer live.
The ability to manage elements is one step towards the alerting features we're working on.
Wireless Summary Export Filename
The daily view in Wireless Summary includes the ability to download the current table view as a CSV which is useful for ad-hoc data analysis or building internal KPIs. The filename of the export now contains the current date, so that subsequent downloads won't overwrite previously saved data.

Preseem Element 1.8.2 (2019-05-10)
This release of the Preseem element software contains small improvements and bug fixes.
- preseemctl system show now includes how long each process has been running
- Upload byte and packet counts were double counted for IP fragments
- preseemctl system check now sanity checks the management interface configuration
- preseemctl system check now properly validates the traffic direction
- preseemctl version show now shows the platform package information
- Preseem 10000: Change core assignment to optimize throughput
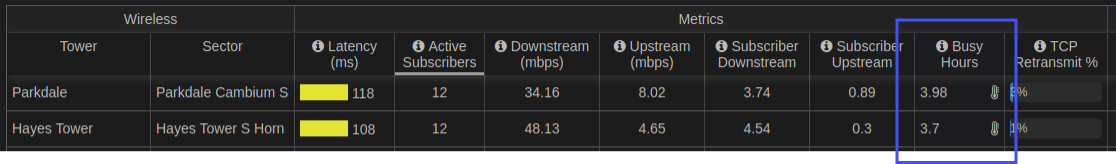
Wireless Summary Busy Hours (2019-05-10)
The Wireless Summary view contains a daily access point metric called Busy Hours. This metric is designed to provide an indication of how busy the access point is by calculating the amount of time per day that it operates near its maximum capacity.
Previously the Busy Hours metric was represented as a progress bar with the % of the day that the access point was operating near its capacity. This was misleading because low percentages like 25% look OK but in reality an access point that is at capacity for 25% of the day is heavily loaded. To address this problem, the representation has been changed to be the number of hours in the day that the access point is busy. If this is longer than a couple hours, then the access point may be in need of an upgrade or split.
Subscriber Details (2019-05-10)
The Explore view has been extended with a subscriber details panel to save you from having to search or jump to the support view to get subscriber information. Yay for fewer clicks!

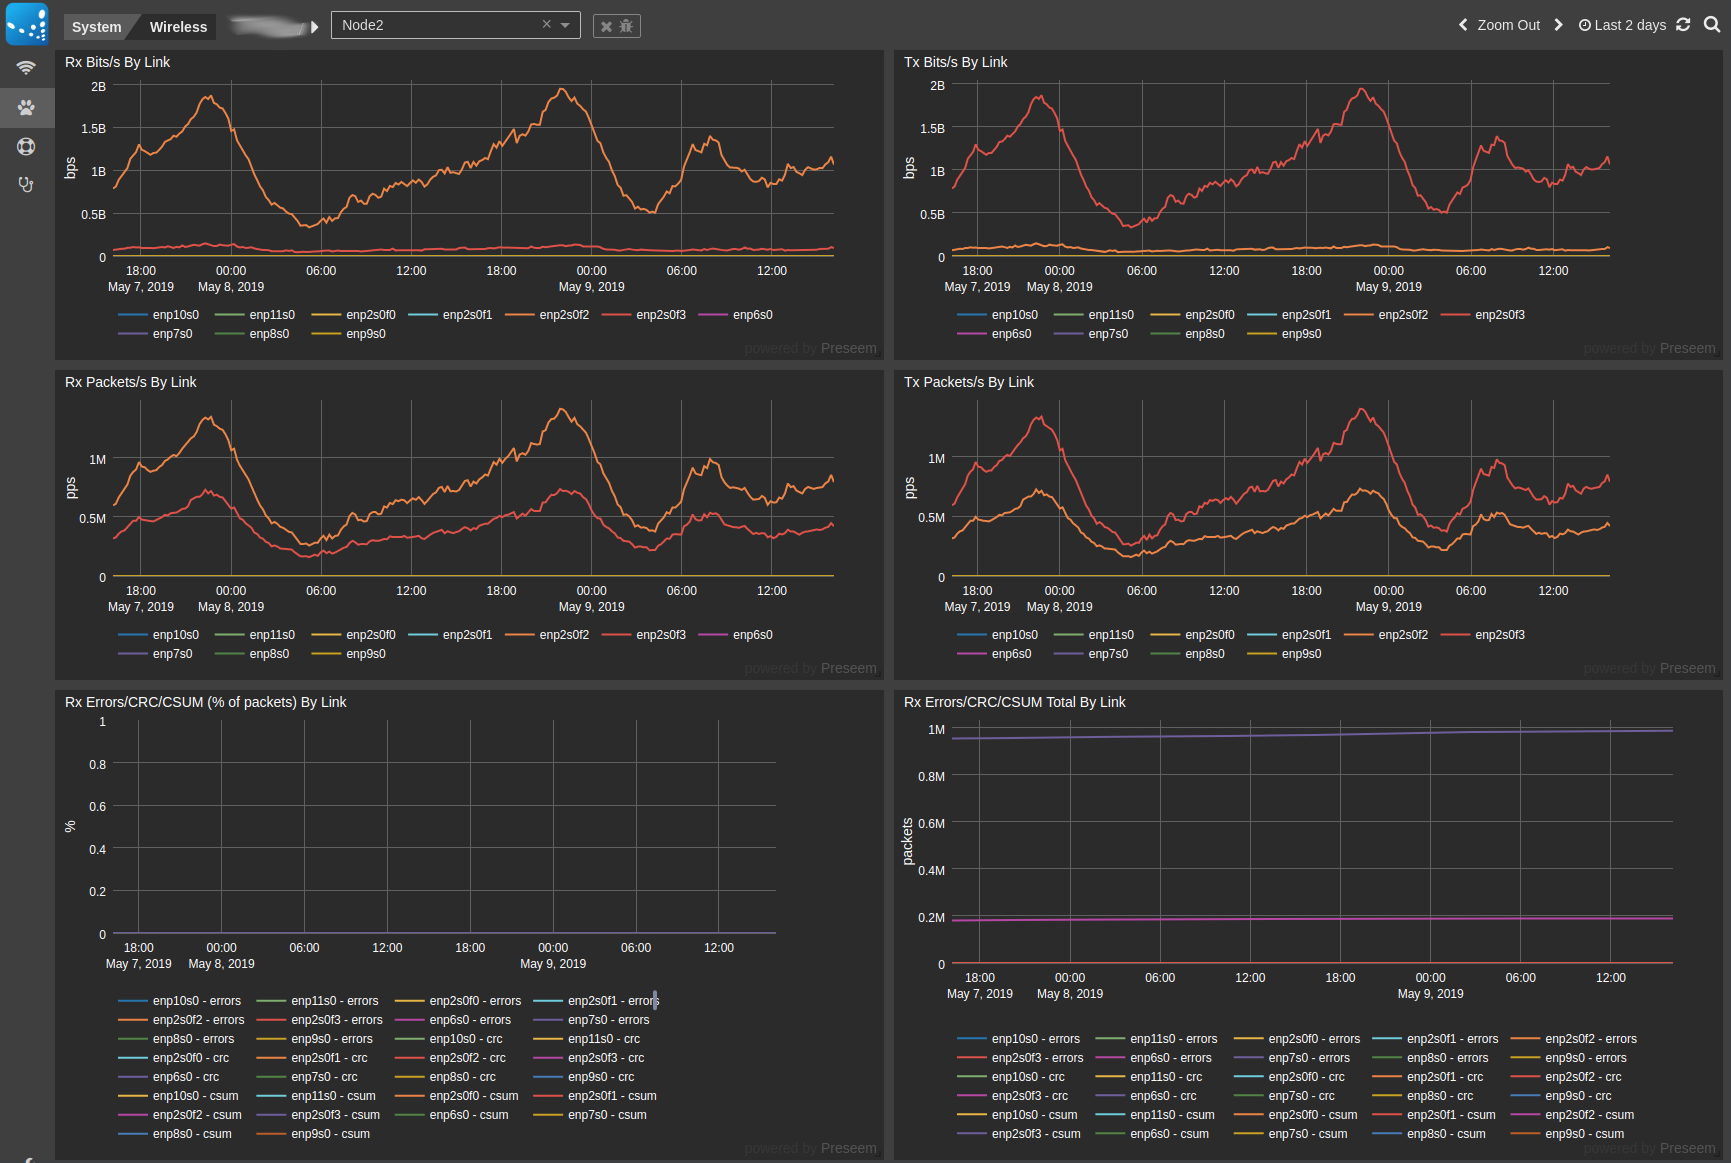
Element System Stats (2019-05-10)
The element view has been extended to add a lower level system details view which exposes items like the raw link rate (vs. the traffic Preseem is inspecting) and link CRC errors. This makes it easier to debug system load and physical layer problems.
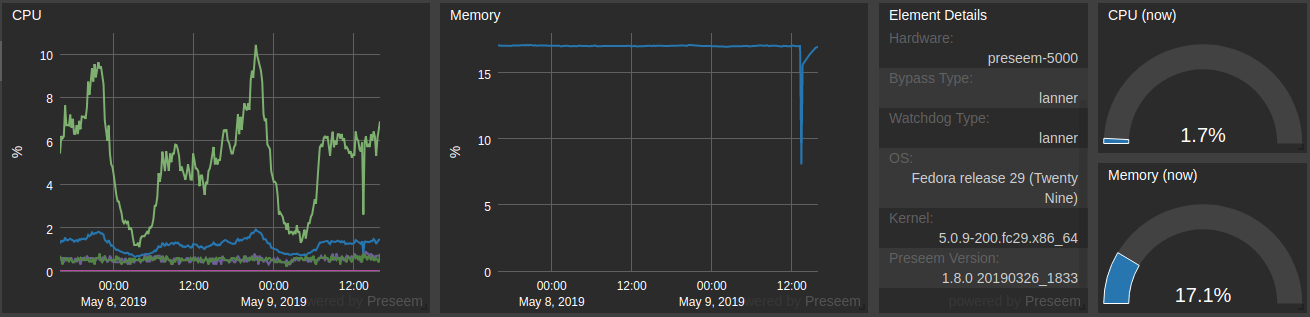
Element Details (2019-05-10)
The element view has been extended to include useful information about the hardware, OS and Preseem software. This saves you from having to login to the element to get this information and makes it easier to manage networks with multiple Preseem elements.
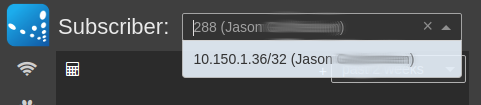
Search By IP in Support (2019-04-26)
When taking a support call, it is often useful to be able to search by the subscriber's IP address not just their name. This is now possible directly in the support view (this has been available in Explore for a long time).
API Key Management (2019-04-19)
Preseem API keys are used to provide access to the cloud by Preseem network elements and by third party entities like our billing partners. Now you can create, modify and delete your API keys yourself!
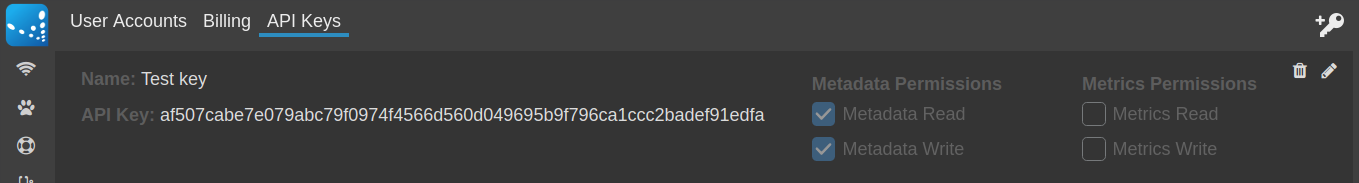
Don't worry, I removed that key after creating the screenshot :)
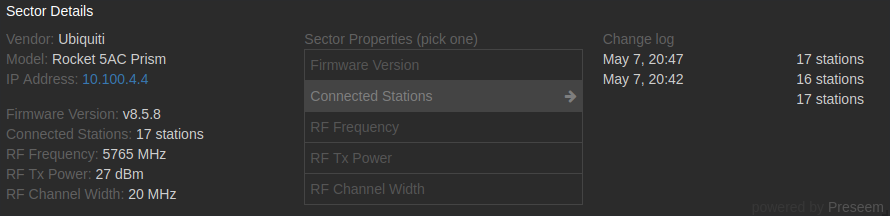
Access Point Details (2019-04-12)
When trying to understand the network QoE it is often useful to know information about the access point of interest. To help make this easier we have added an access point details panel which appears when looking at the QoE metrics associated with an access point. The available information includes:
- Access point vendor
- Access point model
- Firmware version
- Number of connected stations
- Frequency
- Transmission Power
- Channel Width
This new panel also includes a handy link to the AP's management interface so you can jump there quickly!
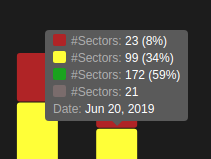
Wireless Summary Quick AP Summary (2019-04-10)
The main Wireless Summary view shows the number of APs by state (color) over time. We added a little tooltip to show the number of APs in each state to make it easier to use these numbers as an internal KPI.
Preseem Element 1.8.0 (2019-04-05)
The Preseem element software refers to the software that runs on the hardware that lives in the network.
The main focus of this release is improving system level performance and increasing subscriber throughput in the presence of high levels of wireless retransmissions.
Features
- Platform optimizations which decrease latency and increase throughput across all Preseem platforms
- New in-memory metrics cache reduces system load and wear on local SSDs
- New custom platform hooks to enable system level optimizations on custom hardware
- Greatly reduce the network impact of restarting core services. This makes it faster and easier to perform upgrades in large networks.
- Optimized shaping parameters to better balance latency and throughput on less than perfect wireless links
- Added JSON and CSV output formats to preseemctl’s metadata list and session list commands to enable easier processing of this information for debugging and integration purposes
- Added new ‘preseemctl system check’ command which validates both the Preseem and system configuration to quickly identify deployment problems
- Many smaller performance improvements and bug fixes
Upgrade Notes
- Standard Preseem upgrade instructions
- The minimum supported kernel version is 4.20
- Generic hardware (not Preseem appliances) and Preseem 1000 deployments must install the appropriate platform package before upgrading the other Preseem packages (platform packages for the Preseem 5000 and 10000 already exist in previous versions and will be upgraded). One of the following commands are required:
dnf install preseem-platform-1000
dnf install preseem-platform-generic
- A system reboot is required for the platform optimizations to take effect