Overview
Account
An account represents a customer of an operator.
-
For example, a person or a company.
-
Typically, operators generate a monthly bill for each active account.
-
Other industry names used for this are “customer”, “user”, “subscriber”.
-
An account has zero or more services.
Service
A service is something of value (such as Internet access) provided to the account holder by the operator.
-
A service can be thought of as a line item on the monthly bill generated for each active account.
-
An Internet service can have an upstream and downstream rate limit defined. Preseem can enforce these limits.
-
When Preseem is shaping, it is enforcing a maximum up and down bitrate for each service. If multiple IP addresses owned by an account should be shaped together, they must be part of the same service in Preseem. If they should be shaped independently, they must be part of different services.
Preseem requires that services define how they are attached to the network by specifying at least one network coordinate that can be used to link the service to the network topology. Supported data fields that can be used for this include:
-
CPE MAC address: a MAC address of a CPE device at the subscriber’s premises.
-
Device MAC address: a MAC address of the customer device (e.g. wifi router).
-
CPE IP address: the management IP address of a CPE device.
-
IP Address: the IP address assigned to the data service.
-
IMSI: the IMSI assigned to the LTE UE radio (via a SIM card)
-
Serial Number: the serial number of a CPE device.
-
Username: A radius/PPPoE username.
-
CPE Name: the name of a CPE device.
The way Preseem defines a service constrains a service to be attached to the network at exactly one point. Preseem shaping (using the recommended two-level-mq shaping policy) assumes this, and will only bundle IP traffic into the same shaper if the IP traffic attaches to the network at the same topology location.
Package
A package can be thought of as a template for a service; it gives the service a name and a standard set of attributes. For example, an operator may have a “Business Internet” package with 50Mbps down, 10Mbps up and unlimited monthly usage.
Other industry names for this are “service definition”, “plan”, “tariff” and “service”.
In the Preseem data model, a service may reference a package to inherit its attributes such as up and down rate limits.
If the rates defined in a package are changed in the system of record, it is expected that shapers for all services that package is assigned to are immediately and automatically changed as a result.
A service may override some attributes of its package by defining them on the service. In this case, the attributes on the service take precedence.
Functionality
These views can be accessed under the Customer menu item.

Accounts View
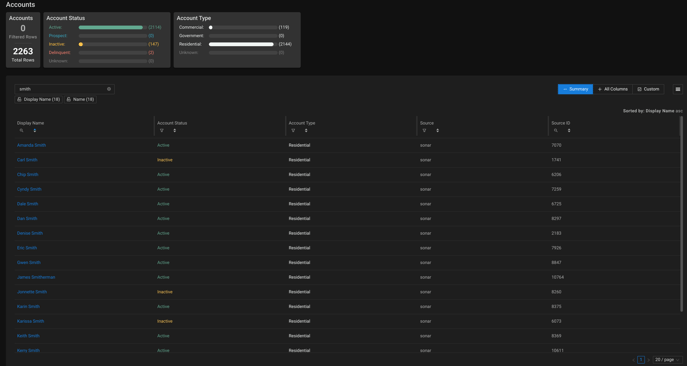
Table Columns:
| Column Name | Description |
|---|---|
| Name | The name of the account. This combines the Name, First Name and Last Name columns. |
| First Name | The first name of the primary contact for the account. |
| Last Name | The last name of the primary contact for the account. |
| Account Status | The status of the account in the system of record. |
| Account Type | The type of account in the system of record. |
| Source | A name for the system of record for this account. |
| Source ID | An identifier for the account in its system of record. |
Clicking on the Display Name opens up an Account Details screen for the account:


The Overview tab shows the attributes of this account, as explained in the table above.
The Download Rate and Upload Rate charts show the download and upload rates over time for the account. This shows at a glance whether the customer is achieving their provisioned plan speeds.
- The Service line shows the maximum active upload or download rate for the service. This can change due to plan changes or status changes (such as blocking of past due accounts).
- The Experience - Peak line shows the peak achieved bitrate as measured every 10 seconds by the Preseem network appliance. This is a good indication of whether the customer is able to hit their active rates. If the peak rate does not come close to the active rate, there may be a problem with the customer's Internet access.
- The Experience - Average line shows the average achieved bitrate over the time interval of the chart. This gives a measure of the continuous network load being consumed by the account.
The Latency chart shows the latency measured for the service by the Preseem appliance. Latency is collected from TCP traffic and measures the path between the Preseem appliance and the end subscriber's device including both network and in-home portions. This can be helpful in understanding the quality of the customer's experience of their Internet service. This chart will have data if there is a Preseem appliance measuring the services of the account.
- The 80th Percentile line represents the typical experience of the customer. Values under 75 are considered an excellent experience, values from 75-125 are considered fair, and values over 125ms are considered poor.
- The 95th Percentile line represents the worst case experience of the customer.
- The 5th Percentile line is used to understand the minimum latency. This line smooths out inconsistencies due to in-home wifi problems and helps to understand the impact of the backhaul and access point RF conditions in the access network.
The Polled Data Usage Daily chart shows how much data the customer uses, as measured by polling the CPE devices the services of the account are attached to. It is used to understand the customer's typical level of usage.
This chart will have data if there is a CPE device assigned to the services of the account, and this is the only service attached to that CPE device.
The Experience Data Usage Daily chart chart shows how much data the customer uses, as measured by the Preseem appliance. It is used to understand the customer's typical level of usage.
This chart will have data if there is a Preseem appliance measuring the services of the account.
The Polled Data Usage Monthly chart shows how much data the customer used over the past four months, as measured by polling the CPE devices the services of the account are attached to. It is used to understand the customer's long-term usage patterns.
This chart will have data if there is a CPE device assigned to the services of the account, and this is the only service attached to that CPE device.
The Experience Data Usage Monthly chart chart shows how much data the customer used over the past four months, as measured by the Preseem appliance. It is used to understand the customer's long-term usage patterns.
This chart will have data if there is a Preseem appliance measuring the services of the account.
Why are there differences between Polled Usage and Experience Usage?
When polled usage (measured by CPE devices) and experience usage (measured by a Preseem appliance) are both available, there may be differences in the reported values due to the different measurement locations in the network.
There may be local broadcast traffic on the CPE device that is not routed through the Preseem appliance.
There may be downstream traffic that is dropped at the Preseem appliance due to shaping.
The Metrics tab shows detailed metrics for the account. The Monthly charts will show data when the selected time range is at least a month in duration.

The Services tab shows the list of Internet services that are active for this account. See the next section for an explanation of the service table.
Services View
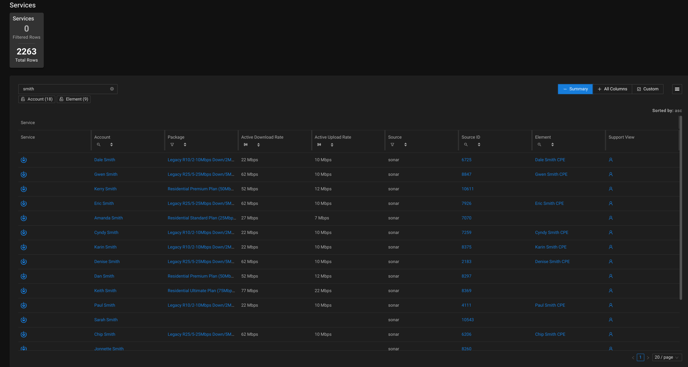
Table Columns:
| Column Name | Description |
|---|---|
| Service | Click to open the Service Details view. |
| Account |
The name of the account that owns this service. |
| Package | The name of the package assigned to this service. Click on the name to open the Package Details view. |
| Active Download Rate |
The maximum bitrate of downstream traffic for this service. If you specify a particular download rate, this becomes your Active Download Rate, allowing for tailored internet speed based on your preferences. If no specific download rate is set, the Active Download Rate automatically defaults to the download rate of the package assigned to your service. |
| Active Upload Rate |
The maximum bitrate for upstream traffic that is If you specify a particular upload rate, this becomes your Active Upload Rate, allowing for tailored internet speed based on your preferences. If no specific upload rate is set, the Active Upload Rate automatically defaults to the download rate of the package assigned to your service. |
| Source | A name for the system of record for this account. If this is colored blue, it is a link to the system of record. |
| Source ID | An identifier for the account in its system of record. |
| Element | The name of the element this service is attached to in the network, if this mapping has been discovered. Click on the name to open the Element Details view. |
| Support View | Click to open the Preseem Support View for this service. |
| Package Download Rate | The maximum bitrate for downstream traffic assigned to this service from its package. |
| Package Upload Rate | The maximum bitrate for upstream traffic assigned to this service from its package. |
| Service Download Rate | The maximum bitrate for downstream traffic assigned directly to this service. This will take precedence over the package download rate. |
| Service Upload Rate | The maximum bitrate for upstream traffic assigned directly to this service. This will take precedence over the package upload rate. |
| Attachment Columns: These are network attachment coordinates from the system of record. They specify how the service should find its point of attachment in the network. At least one of these fields is required for Preseem to automatically associate a Service with an Element. | |
| CPE MAC Address | The MAC address of the CPE access device (such as a CPE Radio or ONT) |
| IMSI | The IMSI assigned to the UE, in a LTE network. |
| CPE Serial Number | The serial number of the CPE device. Currently this is limited to Tarana radios. |
| CPE Name | The name provisioned for the CPE access device. |
| Device MAC Address | The MAC address of the customer router. |
| MAC Address | Any MAC addresses assigned to this service. |
| Network Prefix | Network Prefixes/IP addresses assigned to this service. |
| Username | The RADIUS username assigned to this service. |
Clicking in the Service column opens up an Service Details screen:


The Overview tab shows the attributes of this service, as explained in the table above.
The Download Rate and Upload Rate charts show the download and upload rates over time for the service. This shows at a glance whether the customer is achieving their provisioned plan speeds.
- The Service line shows the maximum active upload or download rate for the service. This can change due to plan changes or status changes (such as blocking of past due accounts).
- The Experience - Peak line shows the peak achieved bitrate as measured every 10 seconds by the Preseem network appliance. This is a good indication of whether the customer is able to hit their active rates. If the peak rate does not come close to the active rate, there may be a problem with the customer's Internet access.
- The Experience - Average line shows the average achieved bitrate over the time interval of the chart. This gives a measure of the continuous network load being consumed by the service.
- The Polled line shows the average achieved bitrate as measured by polling the customer's CPE device, if the CPE device is known. If the service is transiting a Preseem appliance and the CPE device is known, the Experience - Average line should closely match the Experience - Polled line.
The Latency chart shows the latency measured for the service by the Preseem appliance. This can be helpful in understanding the quality of the customer's experience of their Internet service.
- The 80th Percentile line represents the typical experience of the customer. Values under 75 are considered an excellent experience, values from 75-125 are considered fair, and values over 125ms are considered poor.
- The 95th Percentile line represents the worst case experience of the customer.
- The 5th Percentile line is used to understand the minimum latency. This line smooths out inconsistencies due to in-home wifi problems and helps to understand the impact of the backhaul and access point RF conditions in the access network.
The Polled Data Usage Daily chart shows how much data the service uses, as measured by polling the CPE devices the service is attached to. It is used to understand the customer's typical level of usage.
This chart will have data if there is a CPE device assigned to the service, and this is the only service attached to that CPE device.
The Experience Data Usage Daily chart chart shows how much data the service uses, as measured by the Preseem appliance. It is used to understand the customer's typical level of usage.
This chart will have data if there is a Preseem appliance measuring the service.
The Polled Data Usage Monthly chart shows how much data the service used over the past four months, as measured by polling the CPE devices the service. It is used to understand the customer's long-term usage patterns.
This chart will have data if there is a CPE device assigned to the service, and this is the only service attached to that CPE device.
The Experience Data Usage Monthly chart chart shows how much data the service used over the past four months, as measured by the Preseem appliance. It is used to understand the customer's long-term usage patterns.
This chart will have data if there is a Preseem appliance measuring the service.
Why are there differences between Polled Usage and Experience Usage?
When polled usage (measured by CPE devices) and experience usage (measured by a Preseem appliance) are both available, there may be differences in the reported values due to the different measurement locations in the network.
There may be local broadcast traffic on the CPE device that is not routed through the Preseem appliance.
There may be downstream traffic that is dropped at the Preseem appliance due to shaping.
The Metrics tab shows detailed metrics for the service.

Packages View
The Packages view shows all packages that Preseem has imported from the systems of record. This allows packages to be searched, sorted and filtered to verify that Preseem has correctly imported data and to see what speeds are configured on each package.
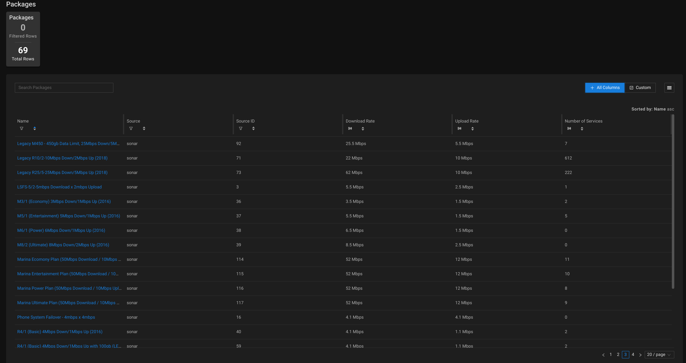
| Column Name | Description |
|---|---|
| Name | A name for the package. |
| Source | A name for the system of record for this package. |
| Source ID | An identifier for the package in its system of record. |
| Download Rate | The maximum bitrate for downstream traffic. |
| Upload Rate | The maximum bitrate for upstream traffic. |
| Number of Services | The number of services currently assigned this package. |
Clicking on the Name opens up a Package Details screen for the package:

The Services tab shows the list of services assigned this package.