Key QoE Concepts for Troubleshooting Subscriber Issues Video
Quality of Experience and Bottlenecks
Quality of Experience is all about how your customers perceive their internet connection. The key factors that impact QoE are bandwidth, latency, and packet loss. When most people think about their internet experience they think about things like speed tests and bandwidth. It turns out that latency is often much more important for a fast-feeling internet. Things like web browsing use little data, but low latency is critical for fast page loads.
"Slow Internet" calls are typically the rest of a poor QoE. The connection is still up—data is being transferred—but it feels slow. QoE issues are caused by bottlenecks in the network.
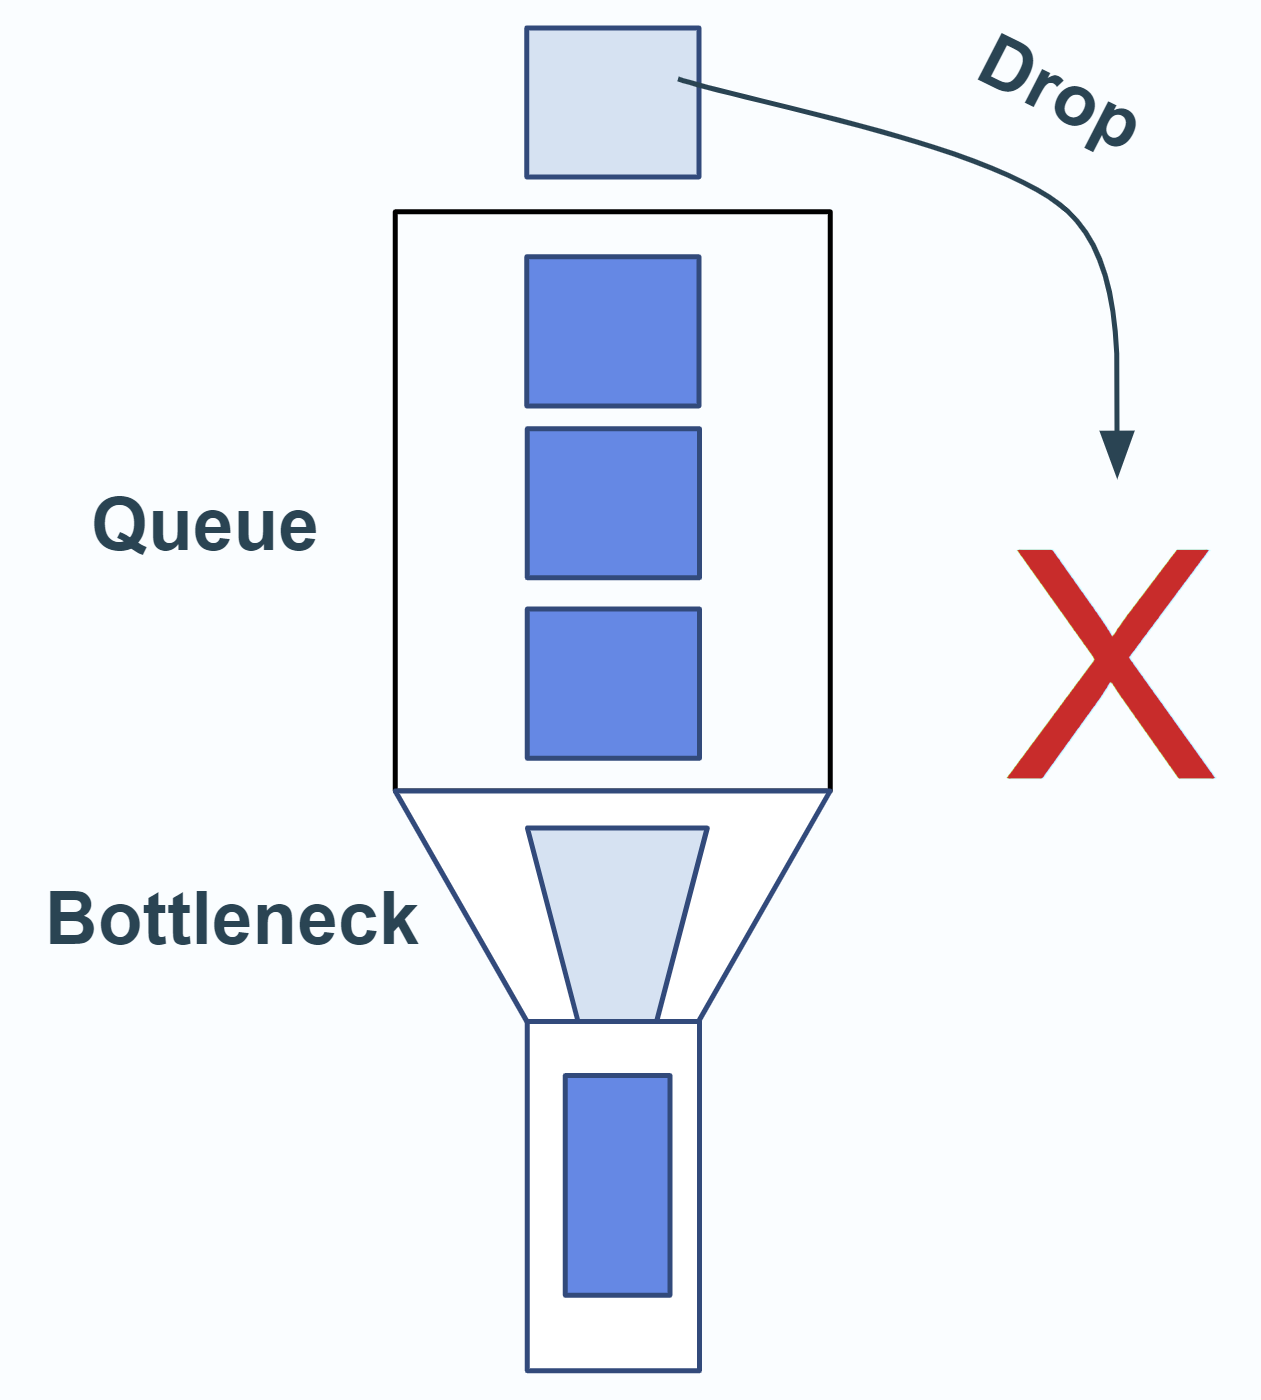
An example of bottlenecks are overloaded access points, low signal strength CPEs, or in-home WiFi issues. A bottleneck is a piece of equipment that has more data coming in than it can transmit, causing it to start buffering packets and eventually dropping them. This causes an increase in latency, and eventually packet loss; thus a slow-feeling internet.
To find these bottlenecks, Preseem measures TCP Round Trip Time (RTT) latency which is based on your actual customers' traffic (not ping). Therefore, it is often a very good indicator of the end user experience, as knowing what the RTT latency is lets you put yourself in your customers' shoes.
How Preseem Measures RTT Latency
All of your customers' traffic goes through a Preseem inline device, typically deployed in the core of your network. Each packet has an IP address which is mapped to a subscriber, access point, and tower. Preseem measures how long it takes for a TCP packet to go from the inline device downstream—through the backhaul, access point, CPE, in-home network, and finally to the end user device (such as a phone, TV, or laptop). TCP on this device then sends back an acknowledgement packet, and when that reaches Preseem it calculates how long that "round trip" time took (which is one latency sample). It then continues to do this for potentially thousands of latency samples, for each subscriber per each 10 second logging interval.
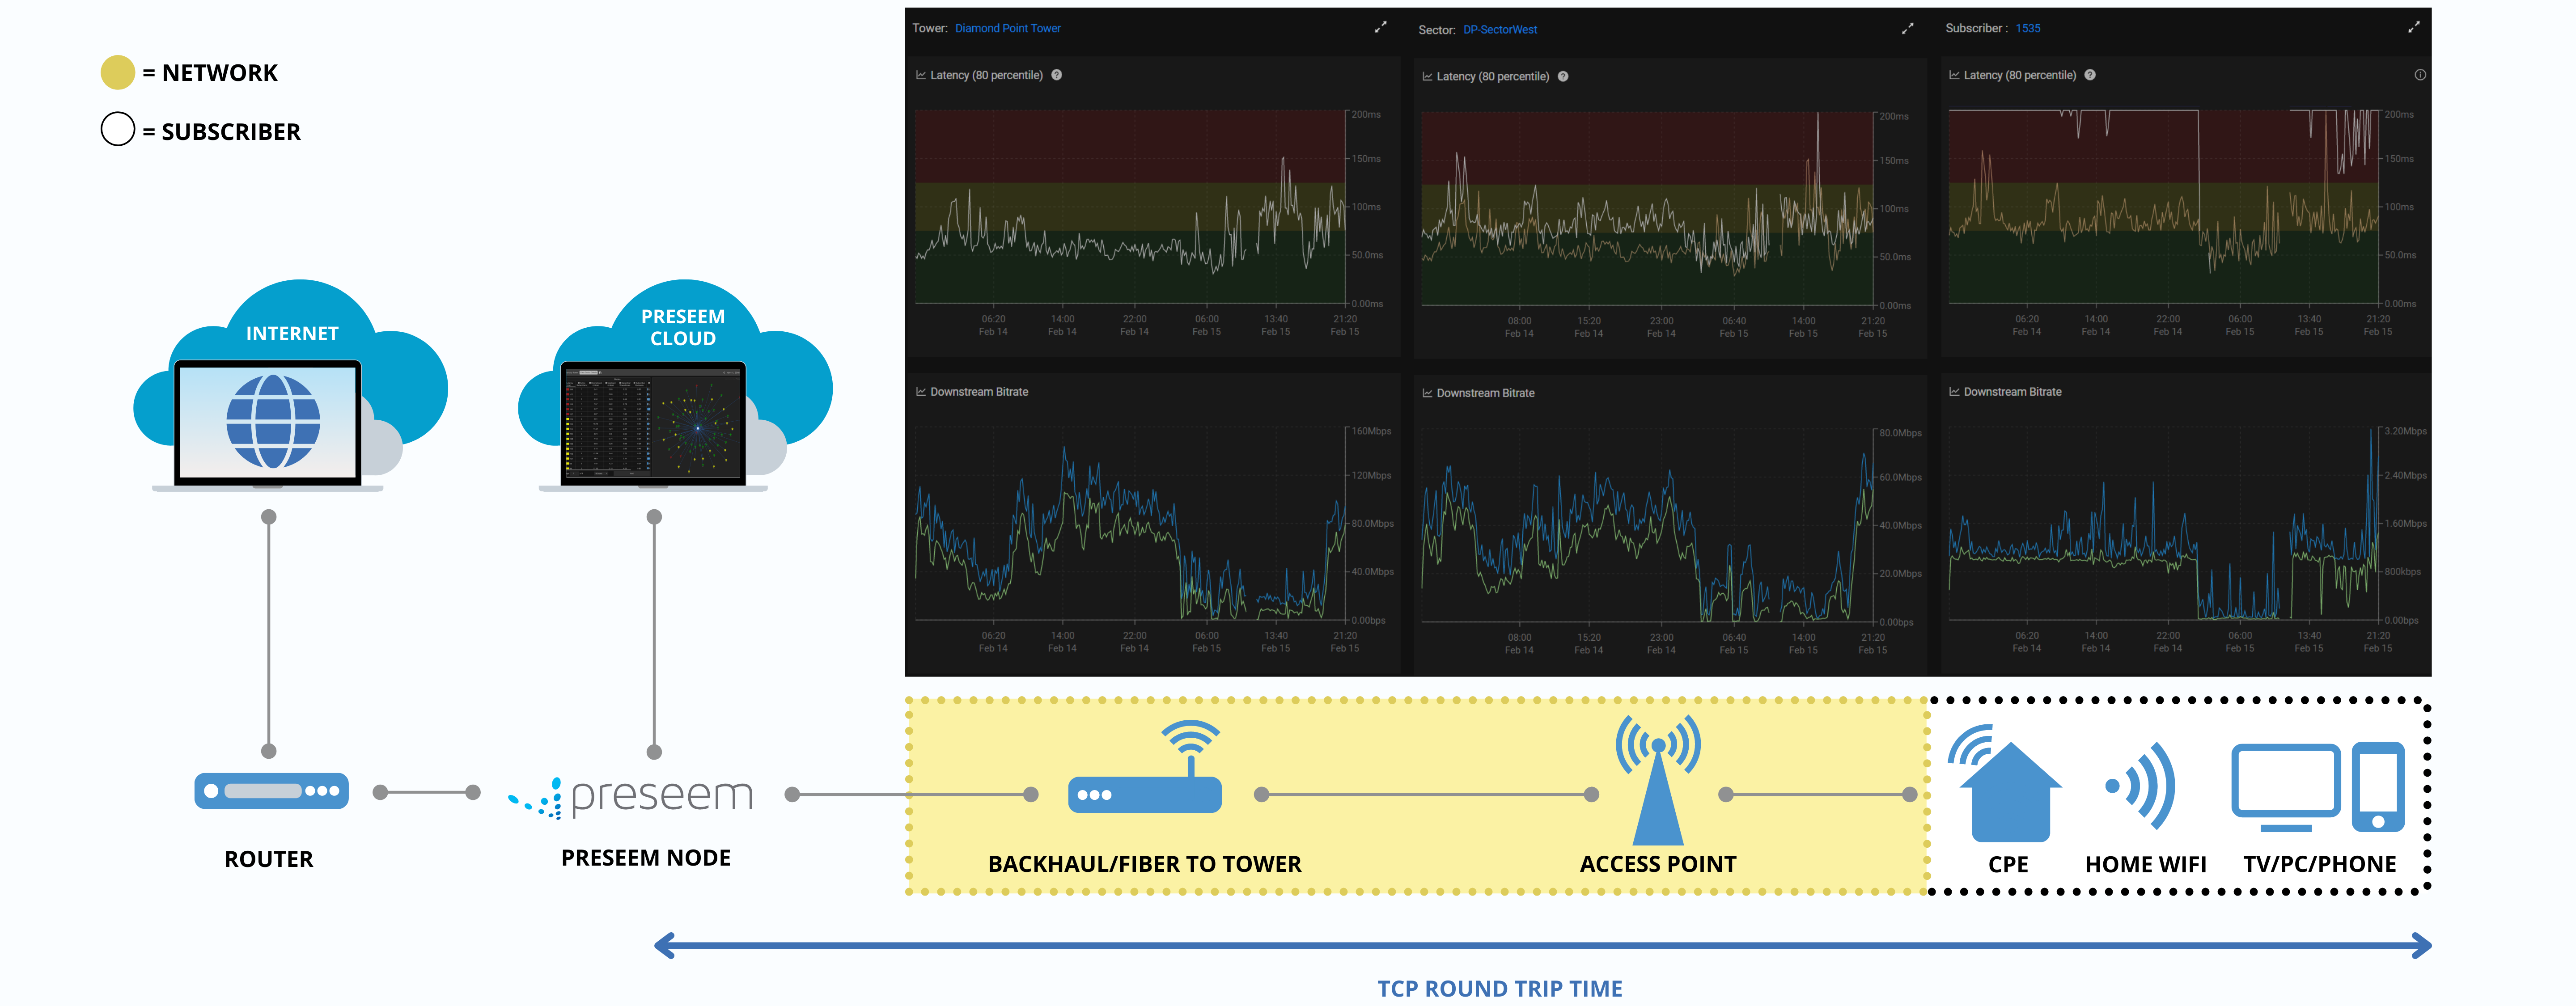
The way that the Preseem support dashboard is laid out matches this simple network diagram. Tower latency (which can show issues with backhauls) on the left panel, sector latency in the middle, and subscriber latency on the right. The yellow line on the subscriber latency chart is the same as the white line in the middle chart to make for an easy visual comparison, which is key to understanding where the high latency is coming from.
Note that sector latency is not latency to the sector but rather the average latency of all the subscribers on that sector. The tower latency is the average latency of all the subscribers on all the sectors on that tower.
Troubleshooting High Latency
If a subscriber has high latency it could come from anywhere along the path that the packets traveled to get from the core network to the end user device. To narrow down where it is coming from you need to compare the latency of the subscriber (white line) with the average latency of all the subscribers on the access point (yellow line)
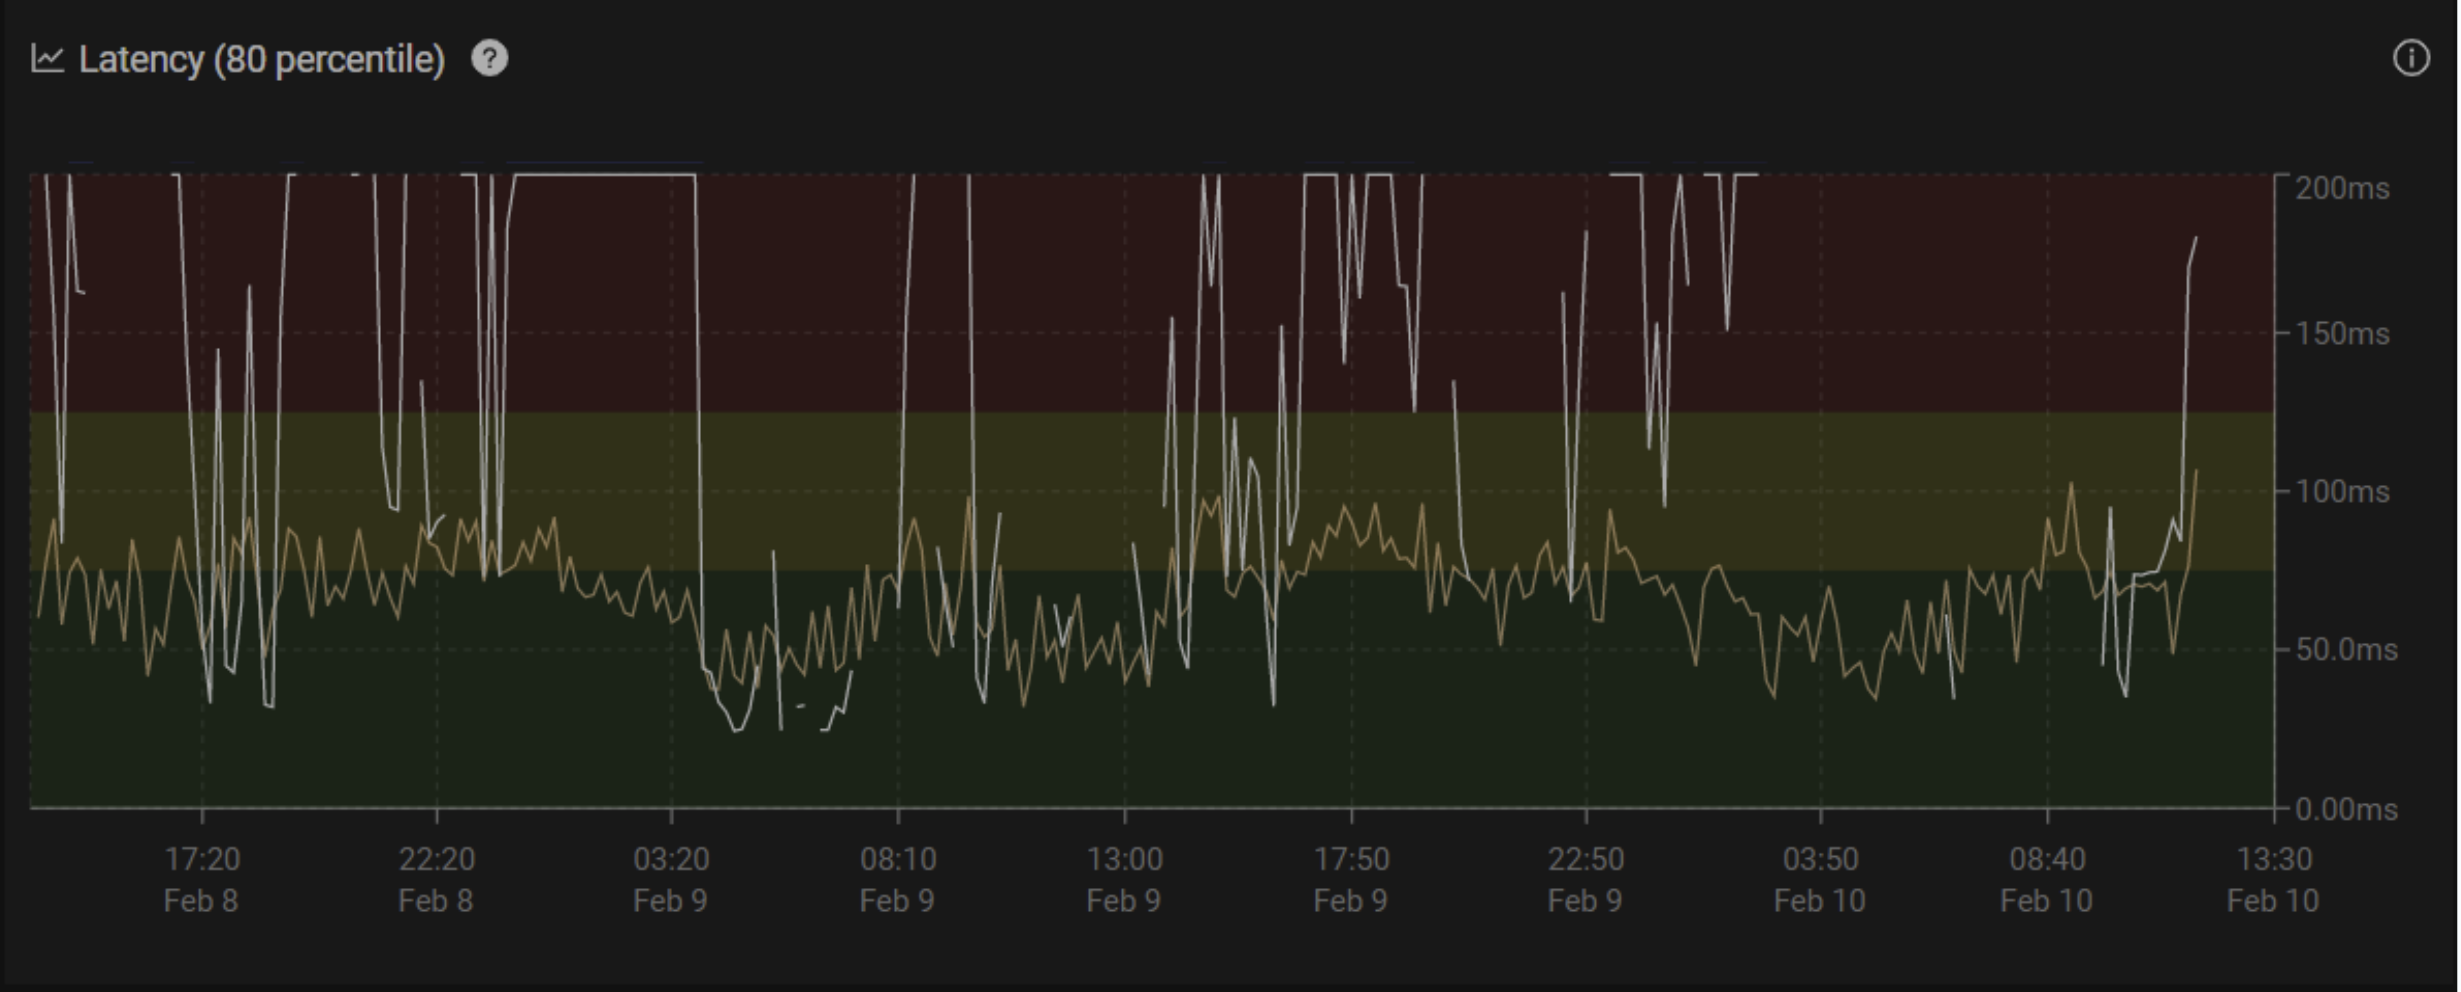
In this example, the subscriber latency (white line) is much higher than the average sector latency (yellow line) which indicates that the network is okay but there is a problem specifically with this subscriber. In this case, check the CPE connection. Poor signal strength for example can cause high latency patterns like this. If the signal strength is fine, in home Wi-Fi issues might be the cause (such as interference or range issues).