Preseem Support Dashboard Walkthrough and Real Examples
Dashboard and Examples
The Preseem support dashboard is designed to put all information required to troubleshoot subscriber issues in one simple dashboard. Start out by finding the subscriber (ID, name or IP) in the search bar at the top left corner.
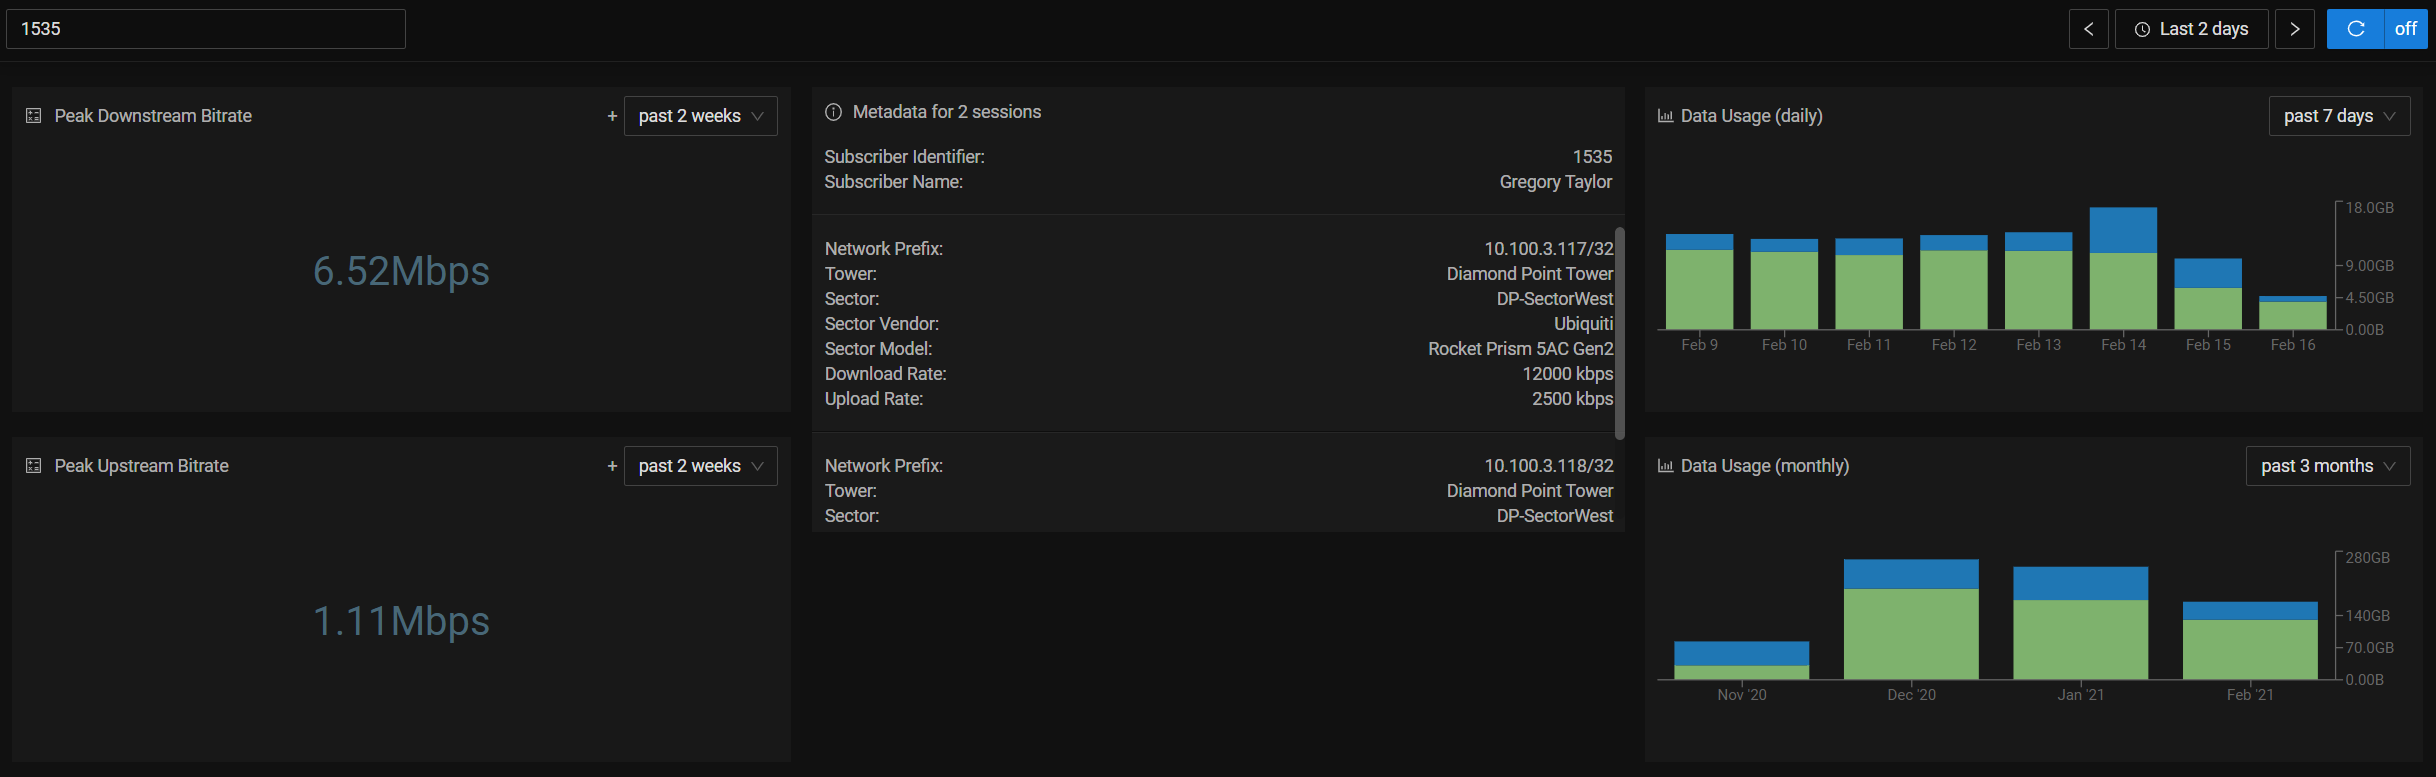
On the top right you can select different date/time ranges and enable automatic refresh (blue button). To view near real time stats, select the last 15 minutes and a 10 second refresh interval.
The Peak Downstream & Upstream bitrate numbers on the left are the biggest 10 second rates over the last two weeks. Bandwidth numbers are measured at the input port to Preseem before shaping is applied. Since the value recorded by Preseem is before shaping is applied, the peak value might be greater than the subscriber plan rate but the actual output bandwidth from Preseem would never exceed the subscriber plan rate.
The rest of the data on the top provides some context about the subscriber as well as their daily and monthly usage to give you an idea of how much data they consume.
The bandwidth & latency charts at the bottom of the dashboard are where most of the troubleshooting is done. The next three sections provide specific examples to typical issues you will come across.
Trouble in the Home - Wi-Fi
These panels are organized as Tower, Sector, Subscriber to quickly see what happens at each level. In this case the subscriber has about 1Mbit down, but their latency (white line in the top right chart) is very high (ideal is under 50ms). The average latency of all the subscribers on this sector (the yellow line in the same chart) is showing a much more reasonable value:
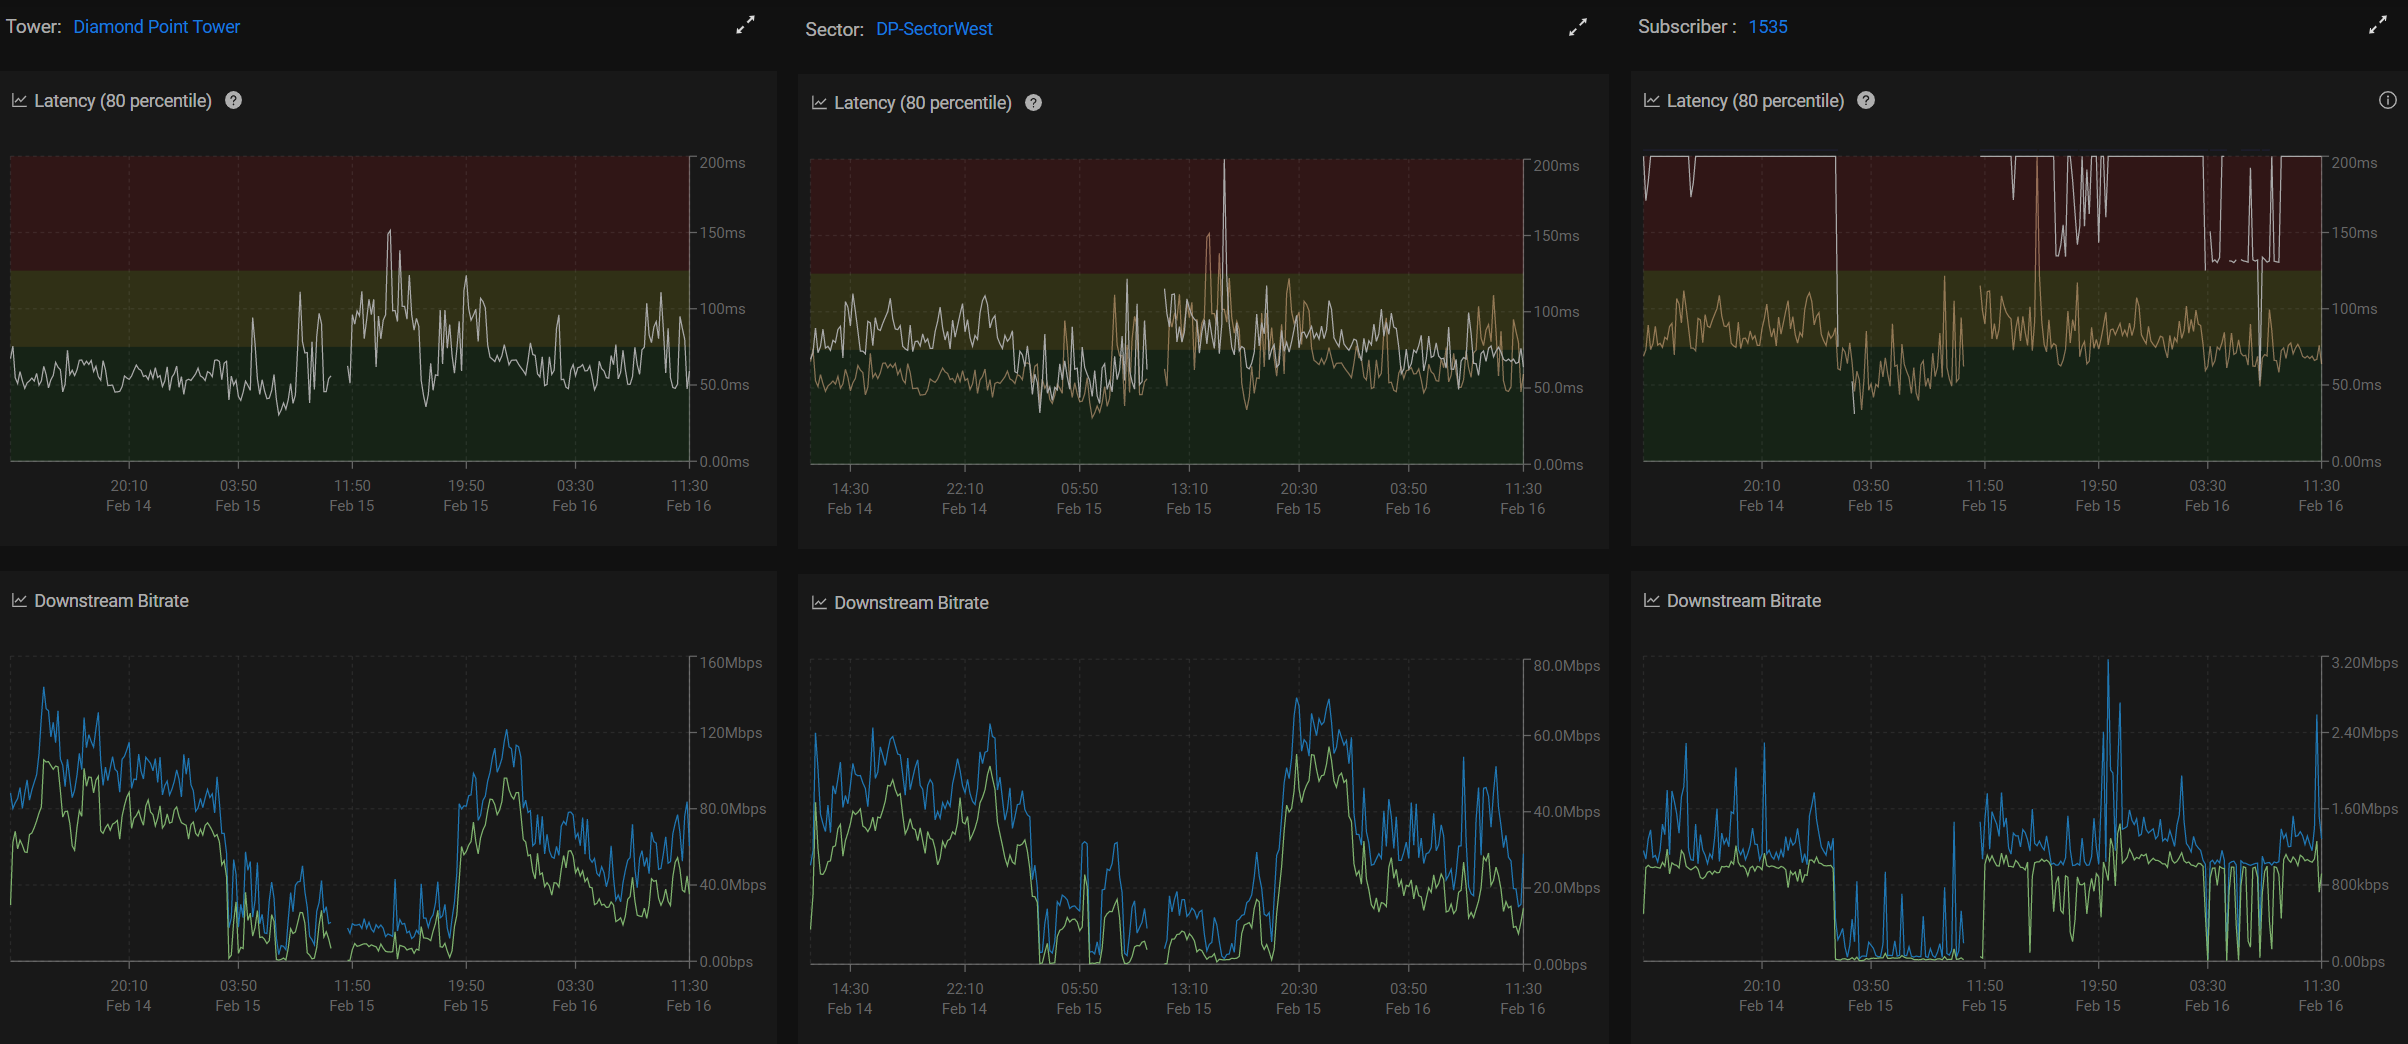
This means that there is an issue that is affecting this subscriber (since their latency is high) and is not affecting the rest of the access point/sector. In the given scenario, it turned out that the signal strength of the CPE is fine (something to check outside of Preseem) and therefore the most likely issue is related to Wi-Fi in the home (range, interference, etc.).
Unhappy Access Point
Our next example shows the subscriber latency is also quite high, especially in the evening hours when the bandwidth is typically higher. Unlike the previous example, the yellow line of the top right chart (average latency of all subscribers on that sector) is also very high and almost identical.
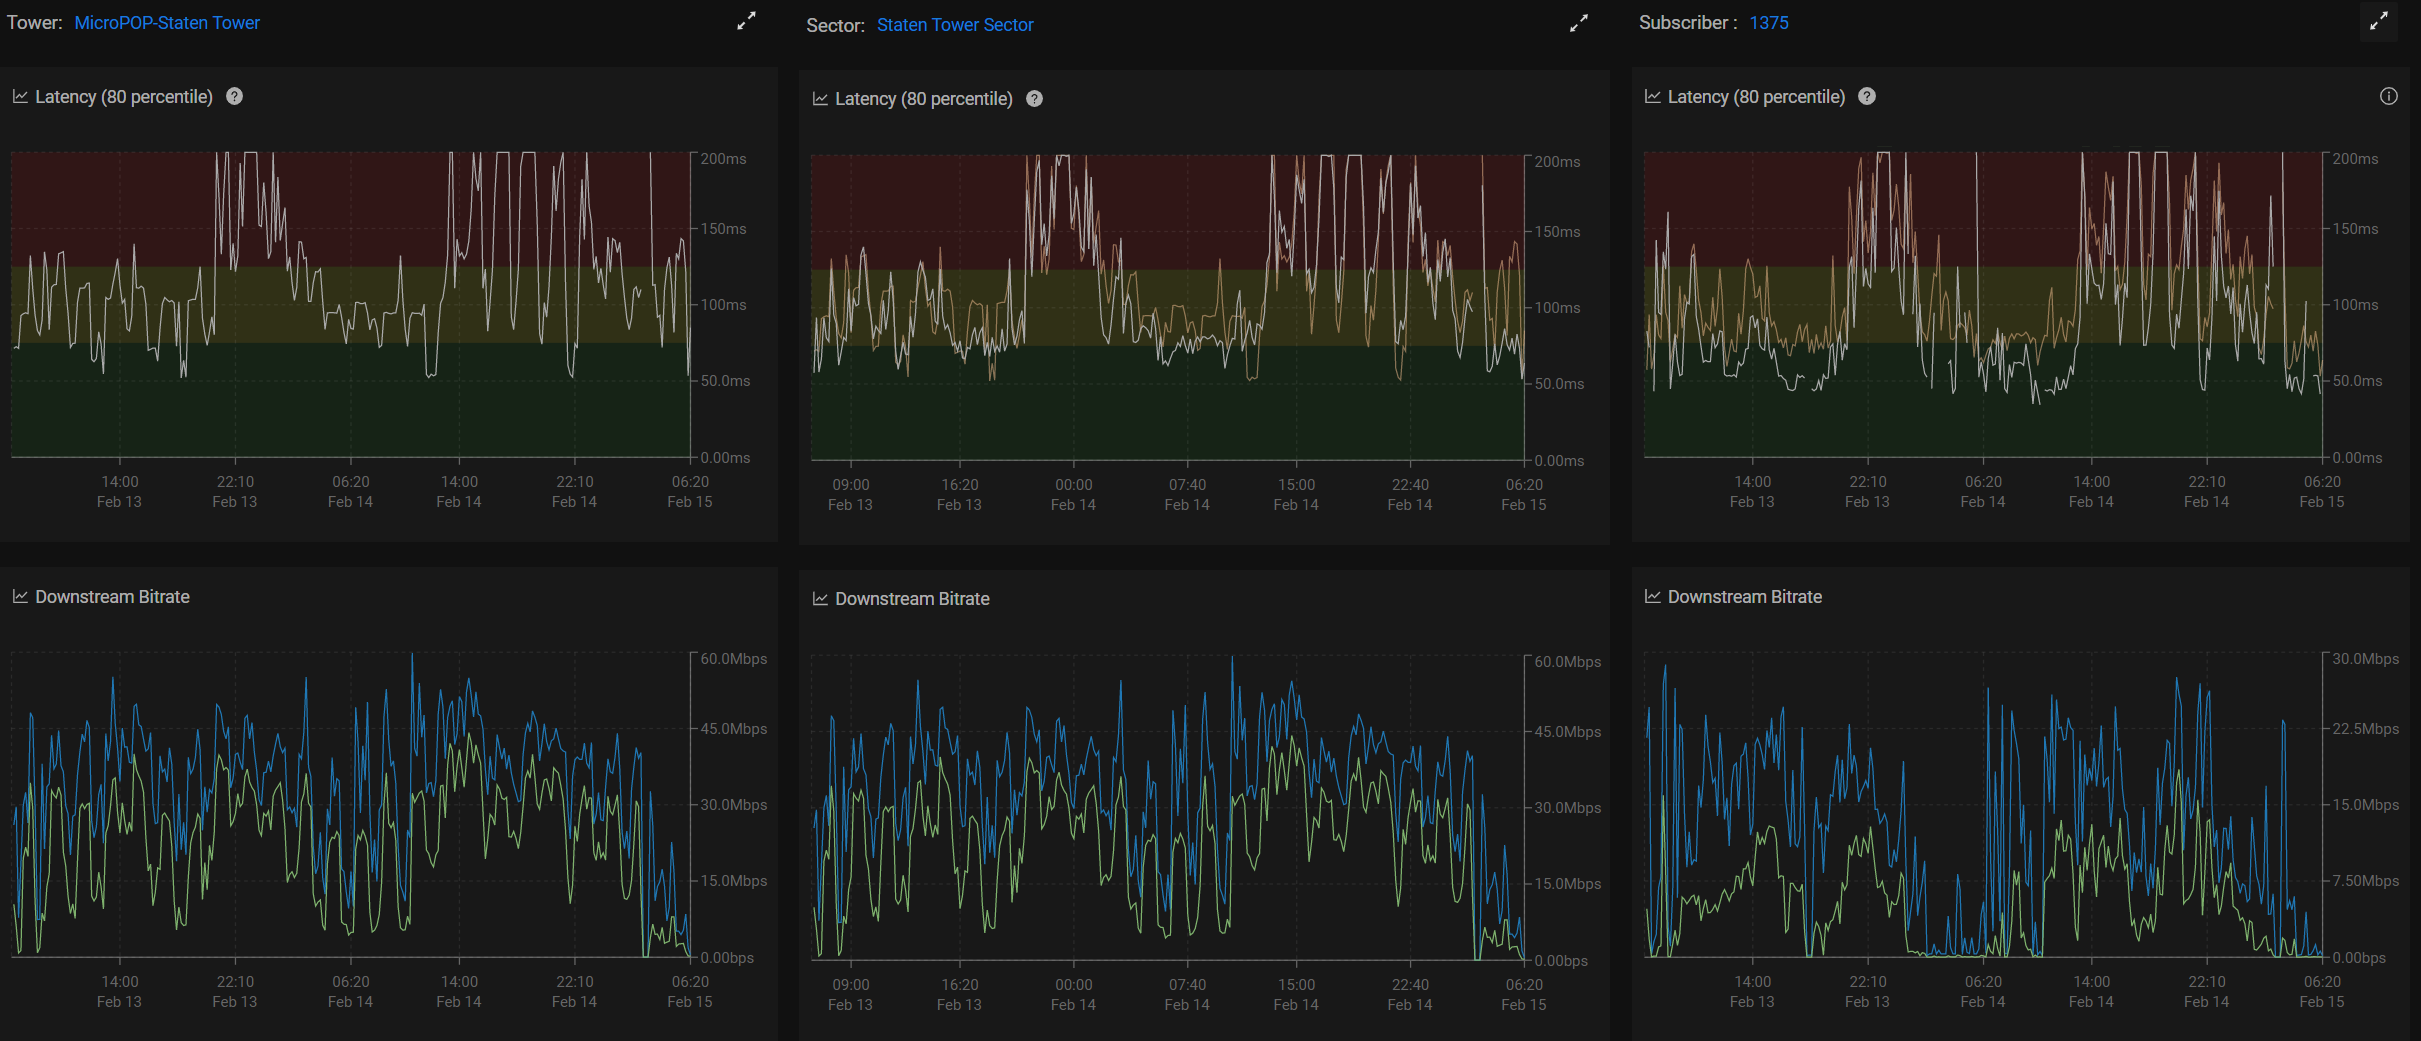
This indicates that there is an issue that is affecting all the subscribers on this access point and therefore not a subscriber specific but network issue. At this point you'll probably create a ticket for another team to dig in and see what is happening with the access point (or lucky you if you're responsible for that as well).
In this case there is only one sector on the tower (tower bandwidth is the same as sector bandwidth and their latency is the same on left and middle panels).
Need For Speed
Look at that nice and low latency for the subscriber and the sector!
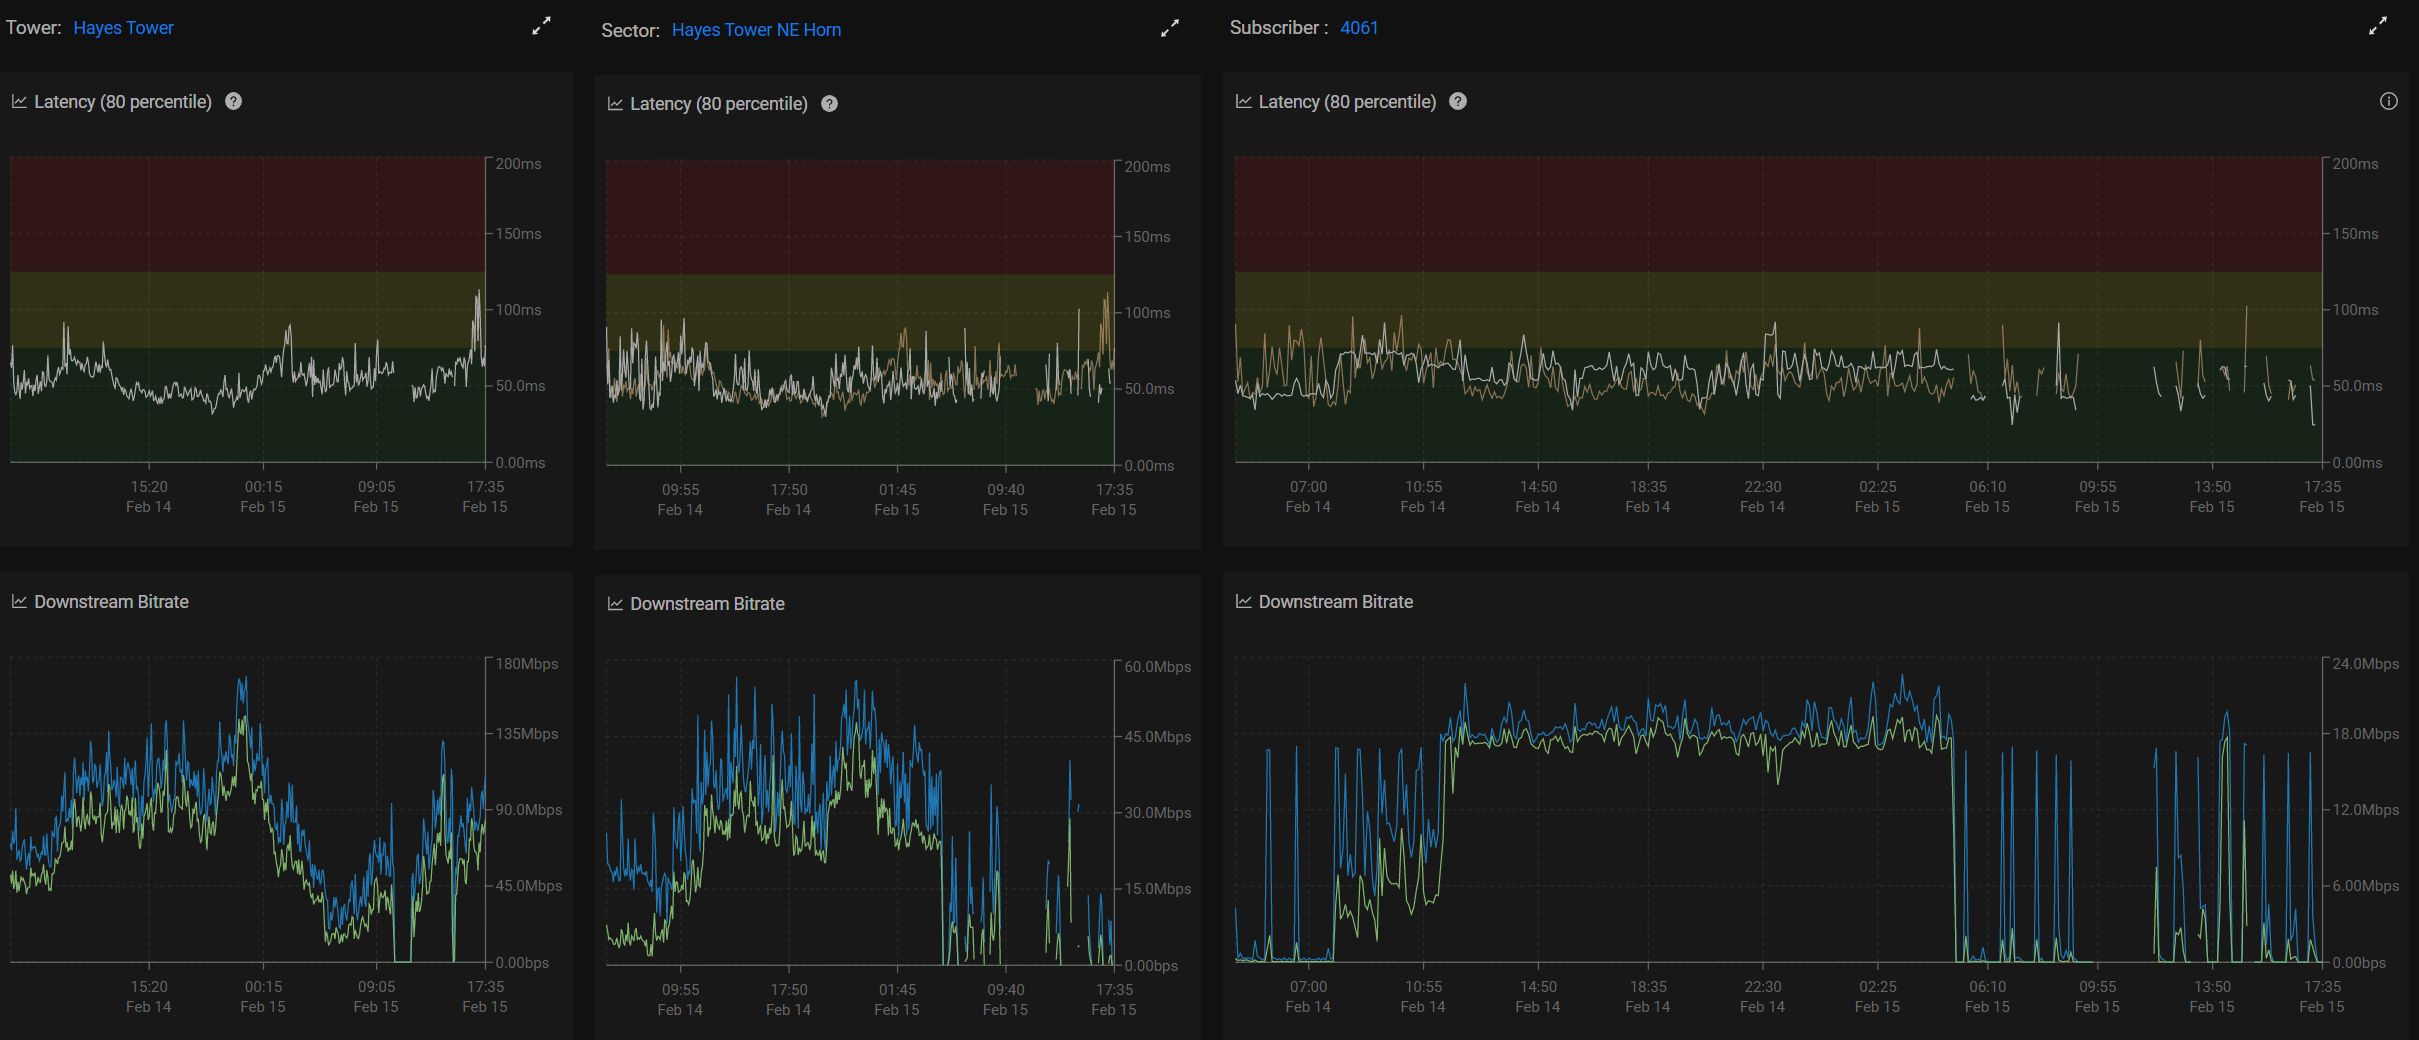
This means there's no obvious bottleneck impacting the end user experience. They are however maxing out their plan speed (17Mbit down) for hours at a time. This subscriber would be a perfect candidate for an upsell to a larger plan speed (low latency + flatlining of bandwidth).
With Preseem optimization, this subscriber should be experiencing fast loading web pages, no video buffering and fast/responsive gaming, but If they are trying to do a number of simultaneous high bandwidth activities (downloads, 4K streaming, etc) they could benefit from more speed.